Ready for the Google Page Experience Update?

Google's Page Experience Update, also known as the Core Web Vitals Update which is slated to launch in May 2021, will be the next strong ranking signal that will influence how your search results rank.
Google's next major algorithm update relies primarily on three clusters of signals from a visitor's experience when viewing a webpage on your website. But even though this new ranking signal, called Page Experience, will be seen as a strong signal, it will not replace the hundreds of other ranking signals like user intent and content relevance as Google is still looking to rank pages with the best information overall. In other words, even the best page experience won't replace having great page content.
However, in cases where many pages can have similar relevance, the page experience can be much more important to search rankings. So, from now on, it's best to start incorporating Core Web Vitals into your SEO strategy to maintain your competitive edge in search results.
After reading this article, you will have a better understanding of what a page experience is and how to improve it on your website to get ready for Google's next major algorithm update.
What is Page Experience?
According to Google, the page experience is a set of signals that measure how users perceive the experience of interacting with a web page beyond its purely informative value. In other words, it is all about how a user perceives the speed of a web page. To do this, Google uses three groups of signals which help evaluate the user’s experience:
- Page Loading performance
- Interactivity Delay
- Visual Stability
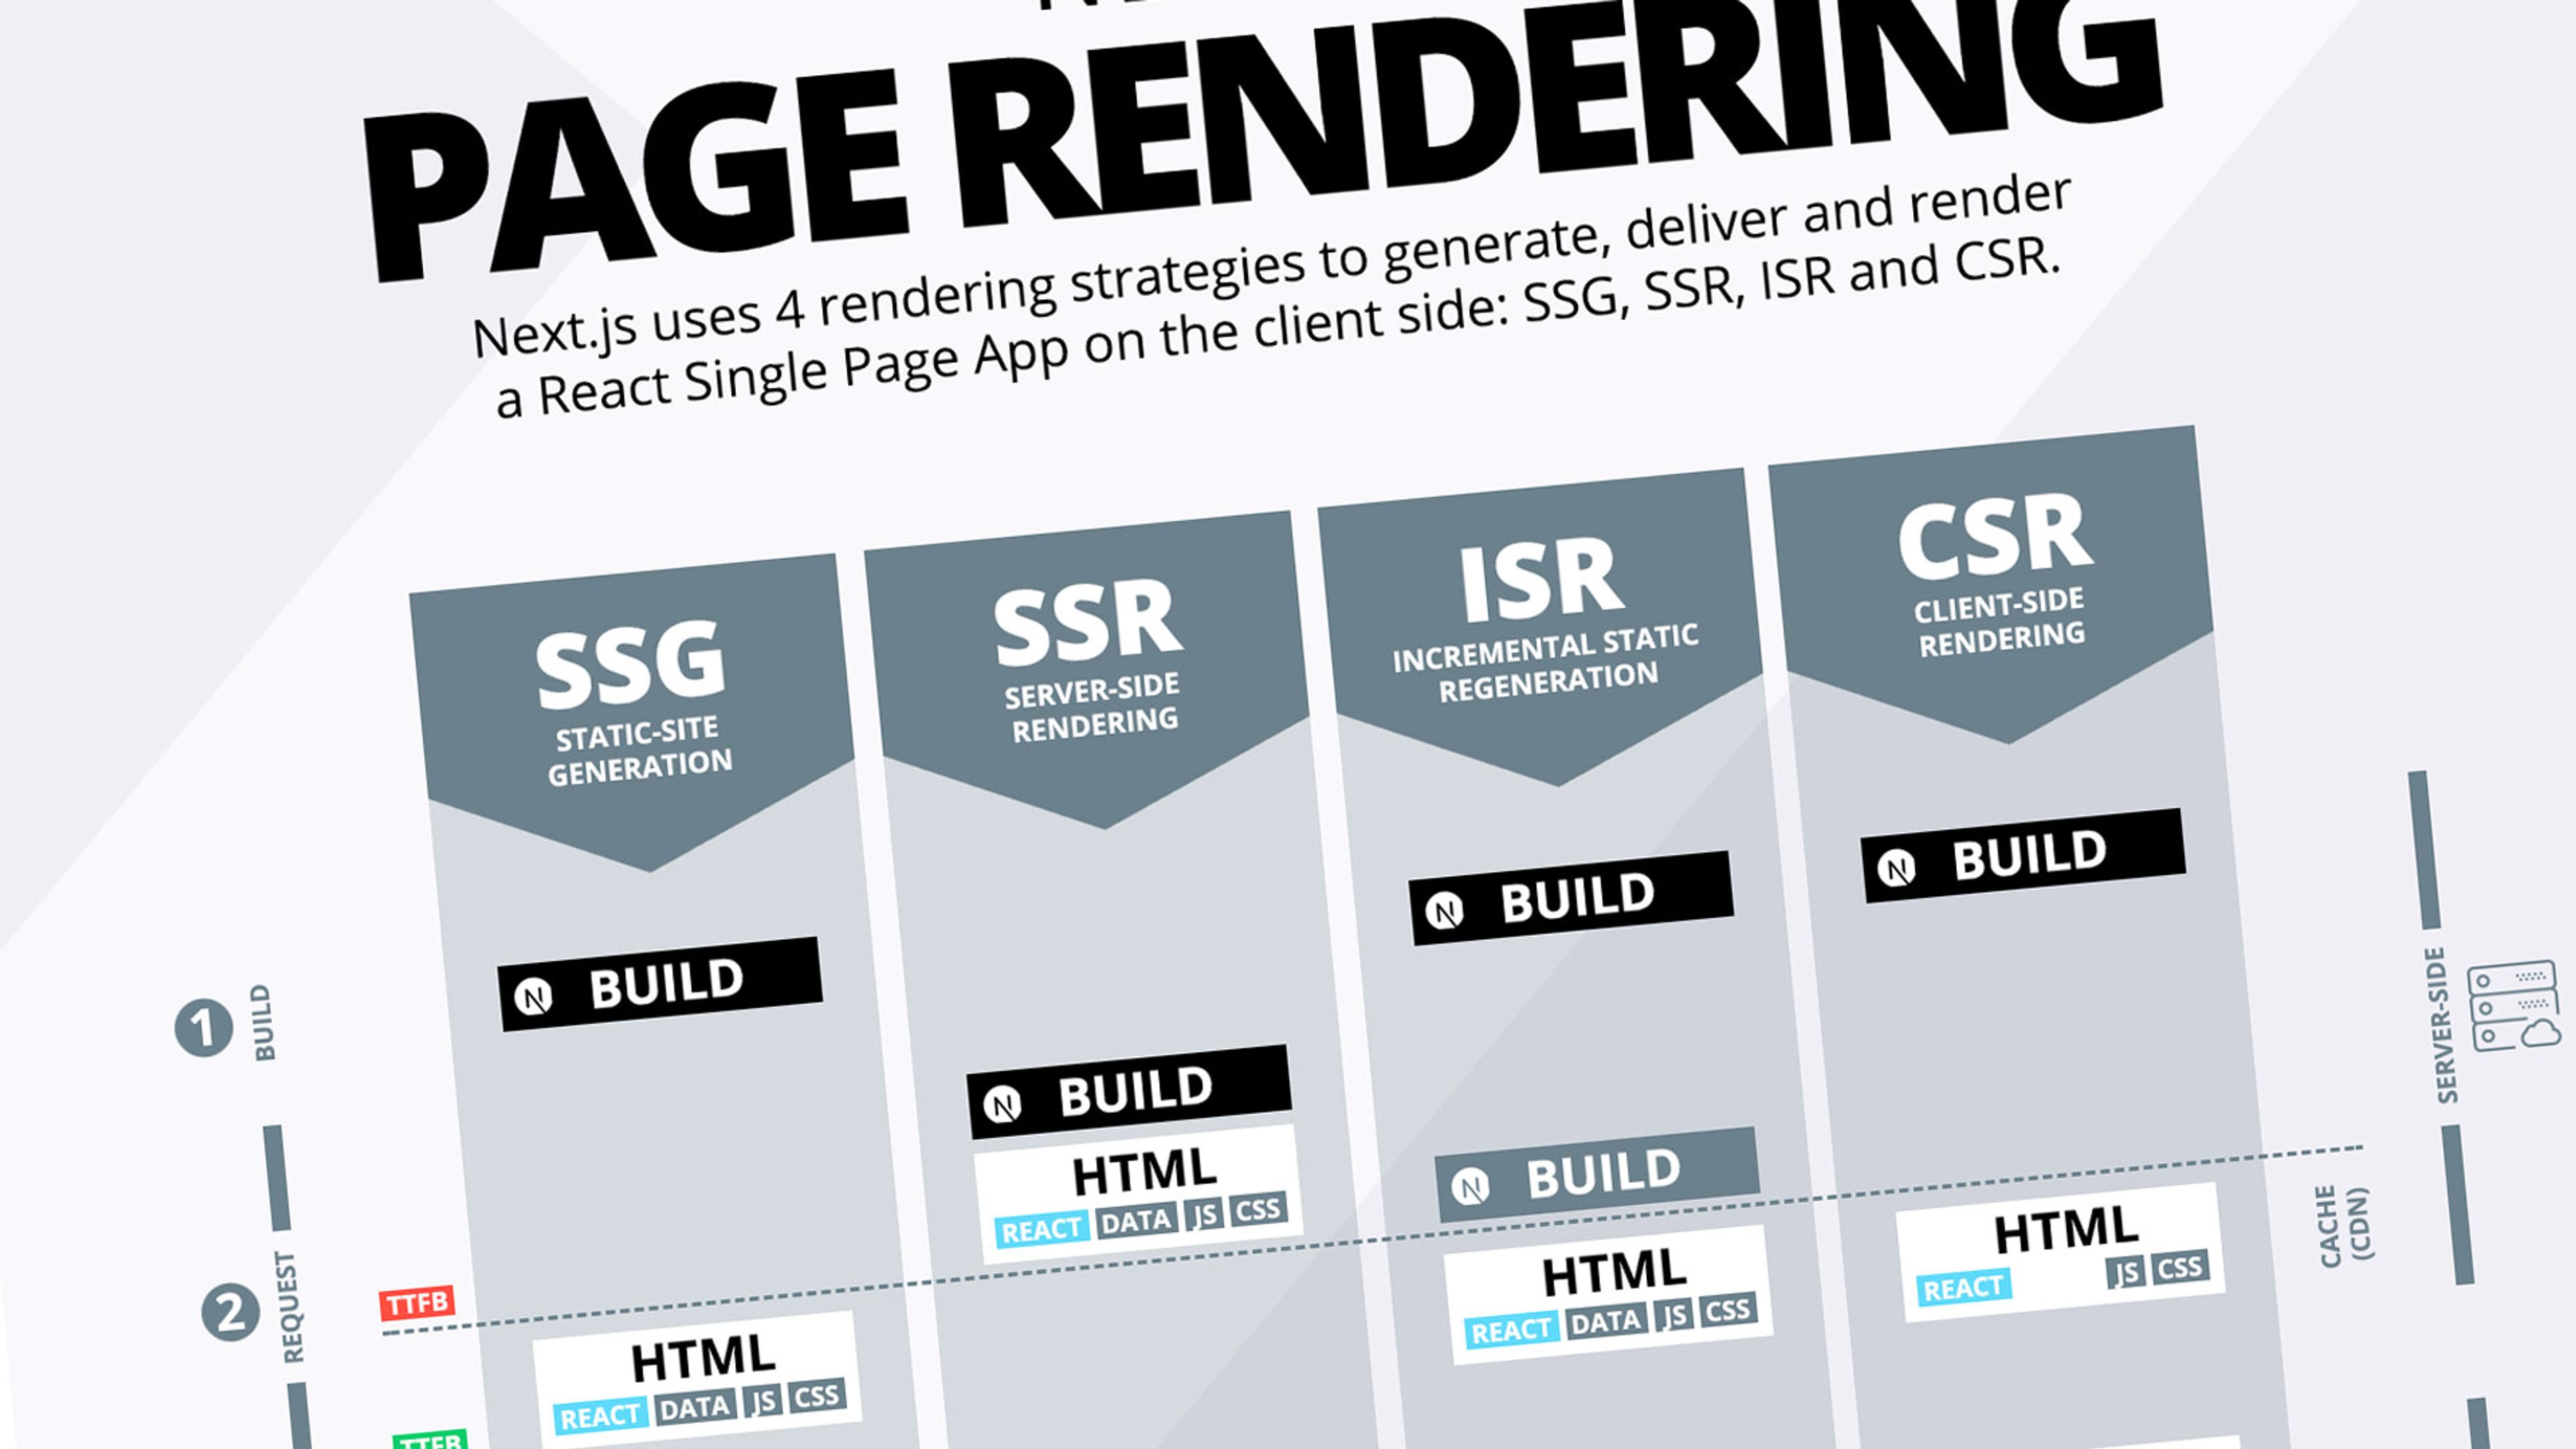
As shown in the infographic below, that you can download for future reference by simply clicking on the image, you can see that Core Web Vitals stands on top, being the latest, of many other updates and signals.
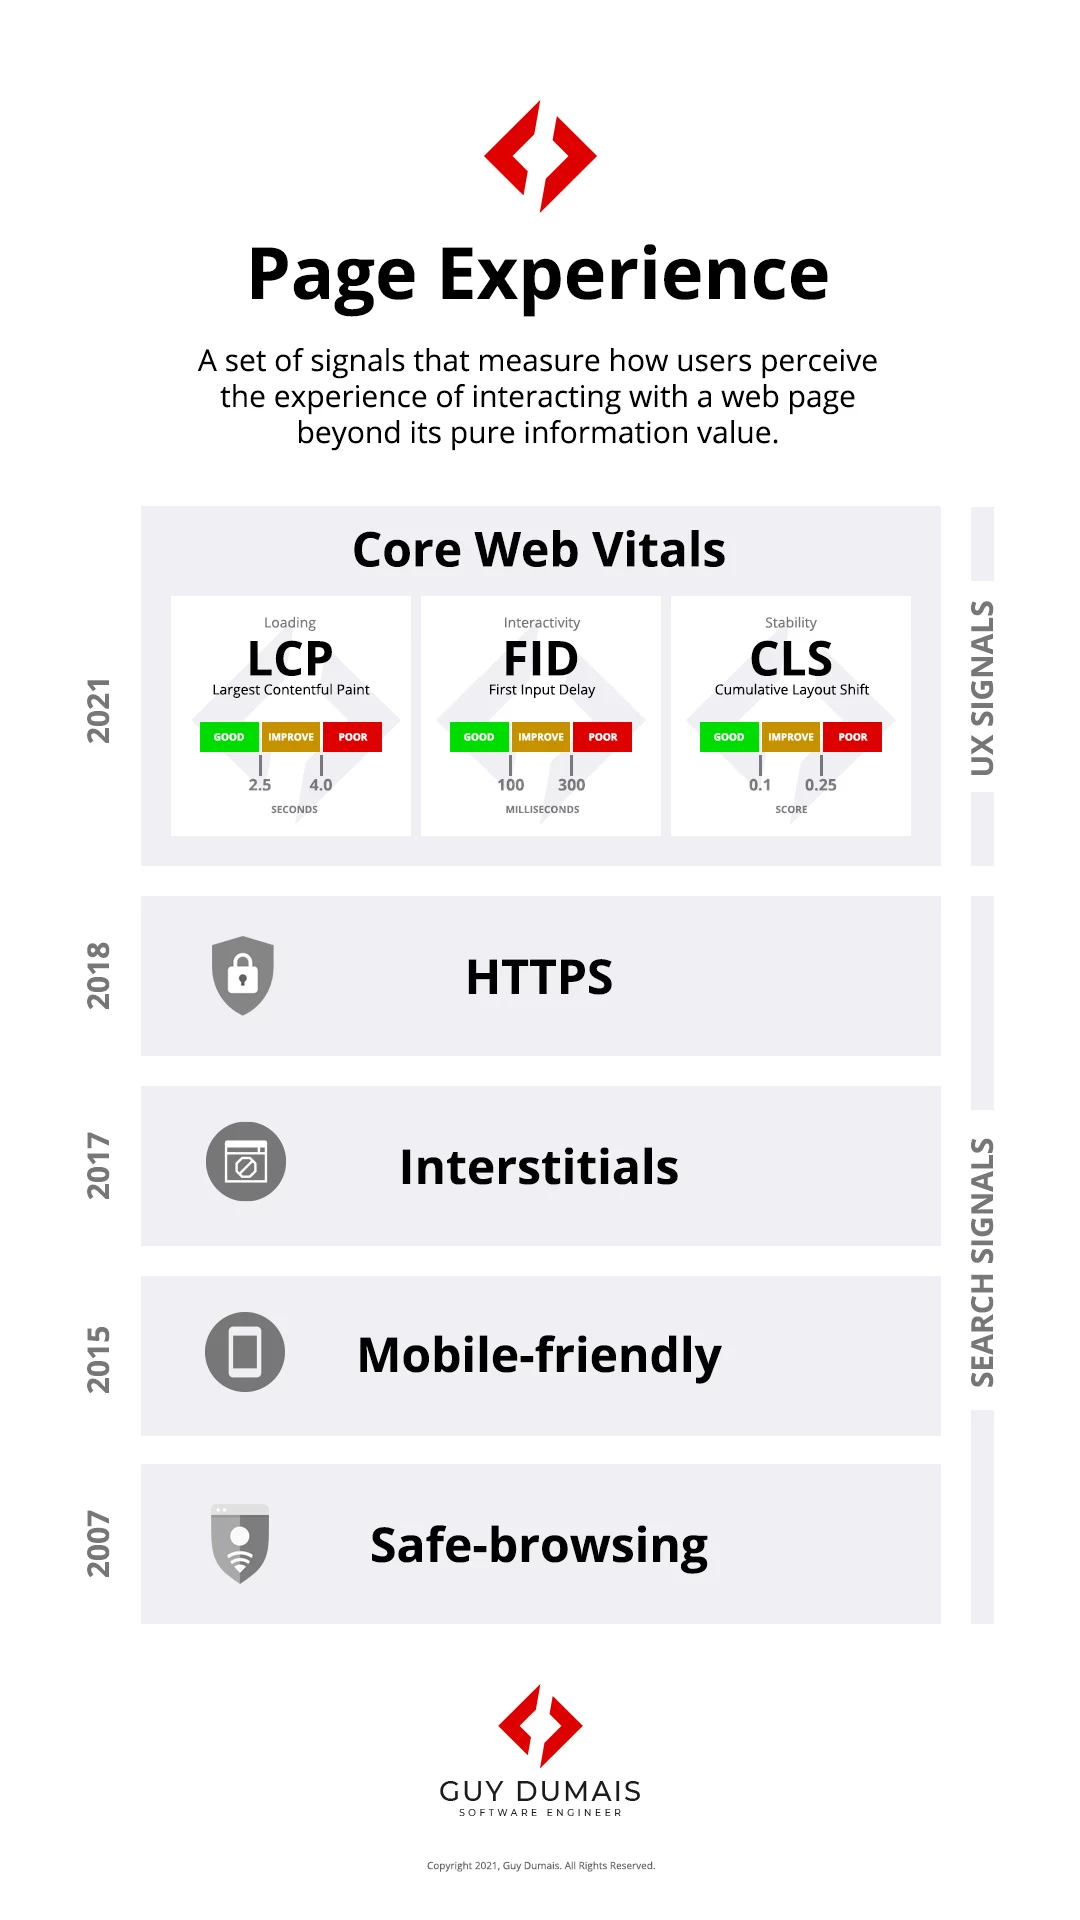
Let’s first quickly look at each of the Core Web Vitals scores that compose the Page Experience signal before using the tools which helps figure out and pinpoint problems about these signals.
Page Loading Performance
To gauge how quickly a page loads, Google uses a metric called Largest Contentful Paint (LCP). In short, LCP indicates the time it takes for the largest element of a web page to appear in the visible part (viewport) of the browser. This is the best way until now to evaluate the user’s perception of the page loading speed.
To be considered good by Google, a web page's LCP score must be less than 2.5 seconds. An LCP score between 2.5 and 4 seconds is considered adequate, but needs further improvement. Any LCP score beyond 4 seconds is considered poor for user experience and should be fixed as soon as possible.
To improve LCP you need to look among four main factors that affect it:
- Slow server response times
- Render-blocking JavaScript and CSS
- Resource load times
- Client-side rendering
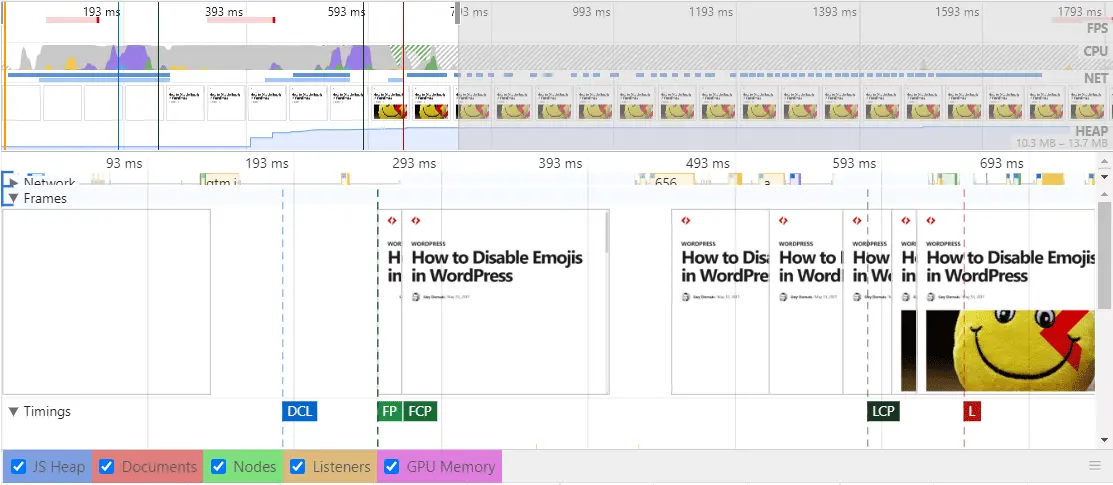
Here is a screenshot from a Lighthouse report about one of my website pages, where you can clearly see where the LCP has occurred over time:
Interactivity Delay
The second user-centric metric used by Google to judge the page experience is the First Input Delay (FID). Briefly, FID tells Google how much time it takes for a web page to get ready for responding to user’s interaction such as scrolling, clicking and typing.
A good web page’s FID must be under 100ms according to Google. An FID score between 100 and 300 milliseconds is still ok but needs improvement whenever possible. Any FID score beyond 300 milliseconds is considered poor for user experience and should be fixed accordingly.
There are many factors that can influence the FID. Here are some of them that can help improve the FID of a web page:
- Lower Javascript running time
- Use asynchronous loading for Javascript
- Break-up large Javascript files into smaller using Code-Splitting
- Reduce the number of resource requests
- Use Progressive Web Application (PWA) with caching strategy
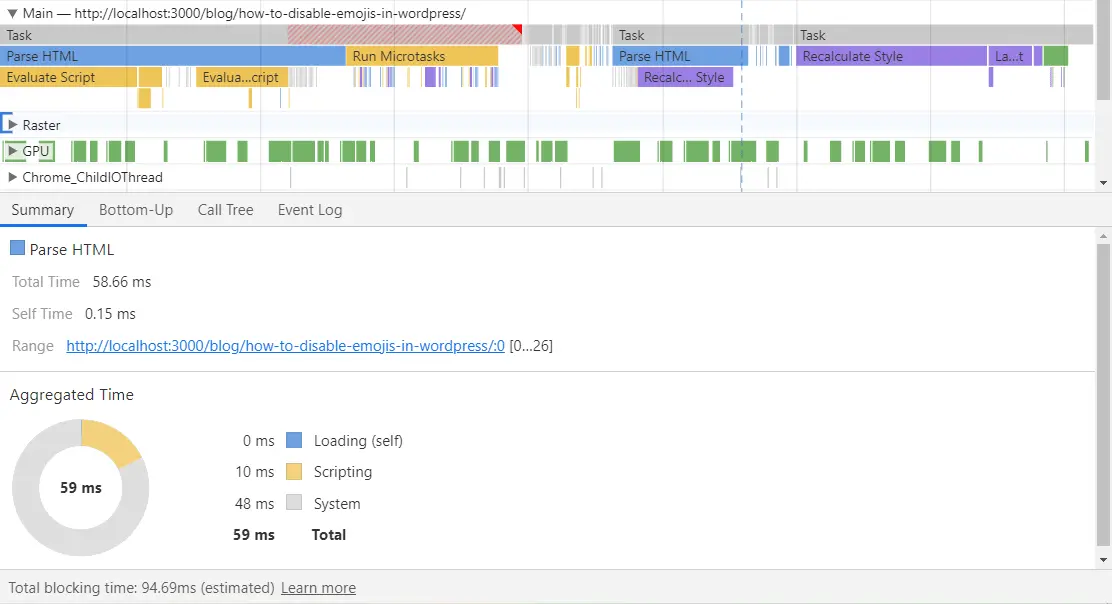
Here's another screenshot coming from the same Lighthouse report, where you can see the Parse HTML operation taking nearly 60ms. Web.dev recommend to keep these long running tasks below 50ms whenever possible:
Visual Stability
The last metric of the Page Experience signal is called the Cumulative Layout Shift (CLS). It is used to evaluate the stability of the visual elements in a web page. What we mean by stability is about the way components appear in the browser's viewport while loading the page without moving around.
For example, a clickable button appears on top of the page but a few seconds later moves down under an image which has just been downloaded. This is bad, very bad at the experience user level. For a good user experience, it is better to avoid as much as possible any parts of your web page moving around, at least at the initial load stage in the viewport.
Here's the best video explanation from web.dev about a bad UI design which affects the CLS. Web.dev is the official website from the Google Chrome Developer Relations team:
A good CLS score must be under 0.1 according to Google’s recommendations. A CLS score between 0.1 and .25 is still acceptable but should be improved whenever possible. Again, any CLS score beyond 0.25 is considered poor for user experience and should be fixed.
There are a lot of factors that can influence the CLS of a web page and often it is coming from missing width and height image attributes. Here are some important places where you should investigate to help improve the CLS of a web page:
- Include image width and height attributes to all your images.
- Include video width and height attributes to all your videos.
- Resize slots with CSS using min-width and min-height.
- Avoid fluid sizes above the fold.
Core Web Vitals Tools
Now that you have a better understanding about Page Experience, let's quickly look at some examples about the online tools I regularly use to analyze web pages performance that will help you figure out potential page speed problems.
Lighthouse
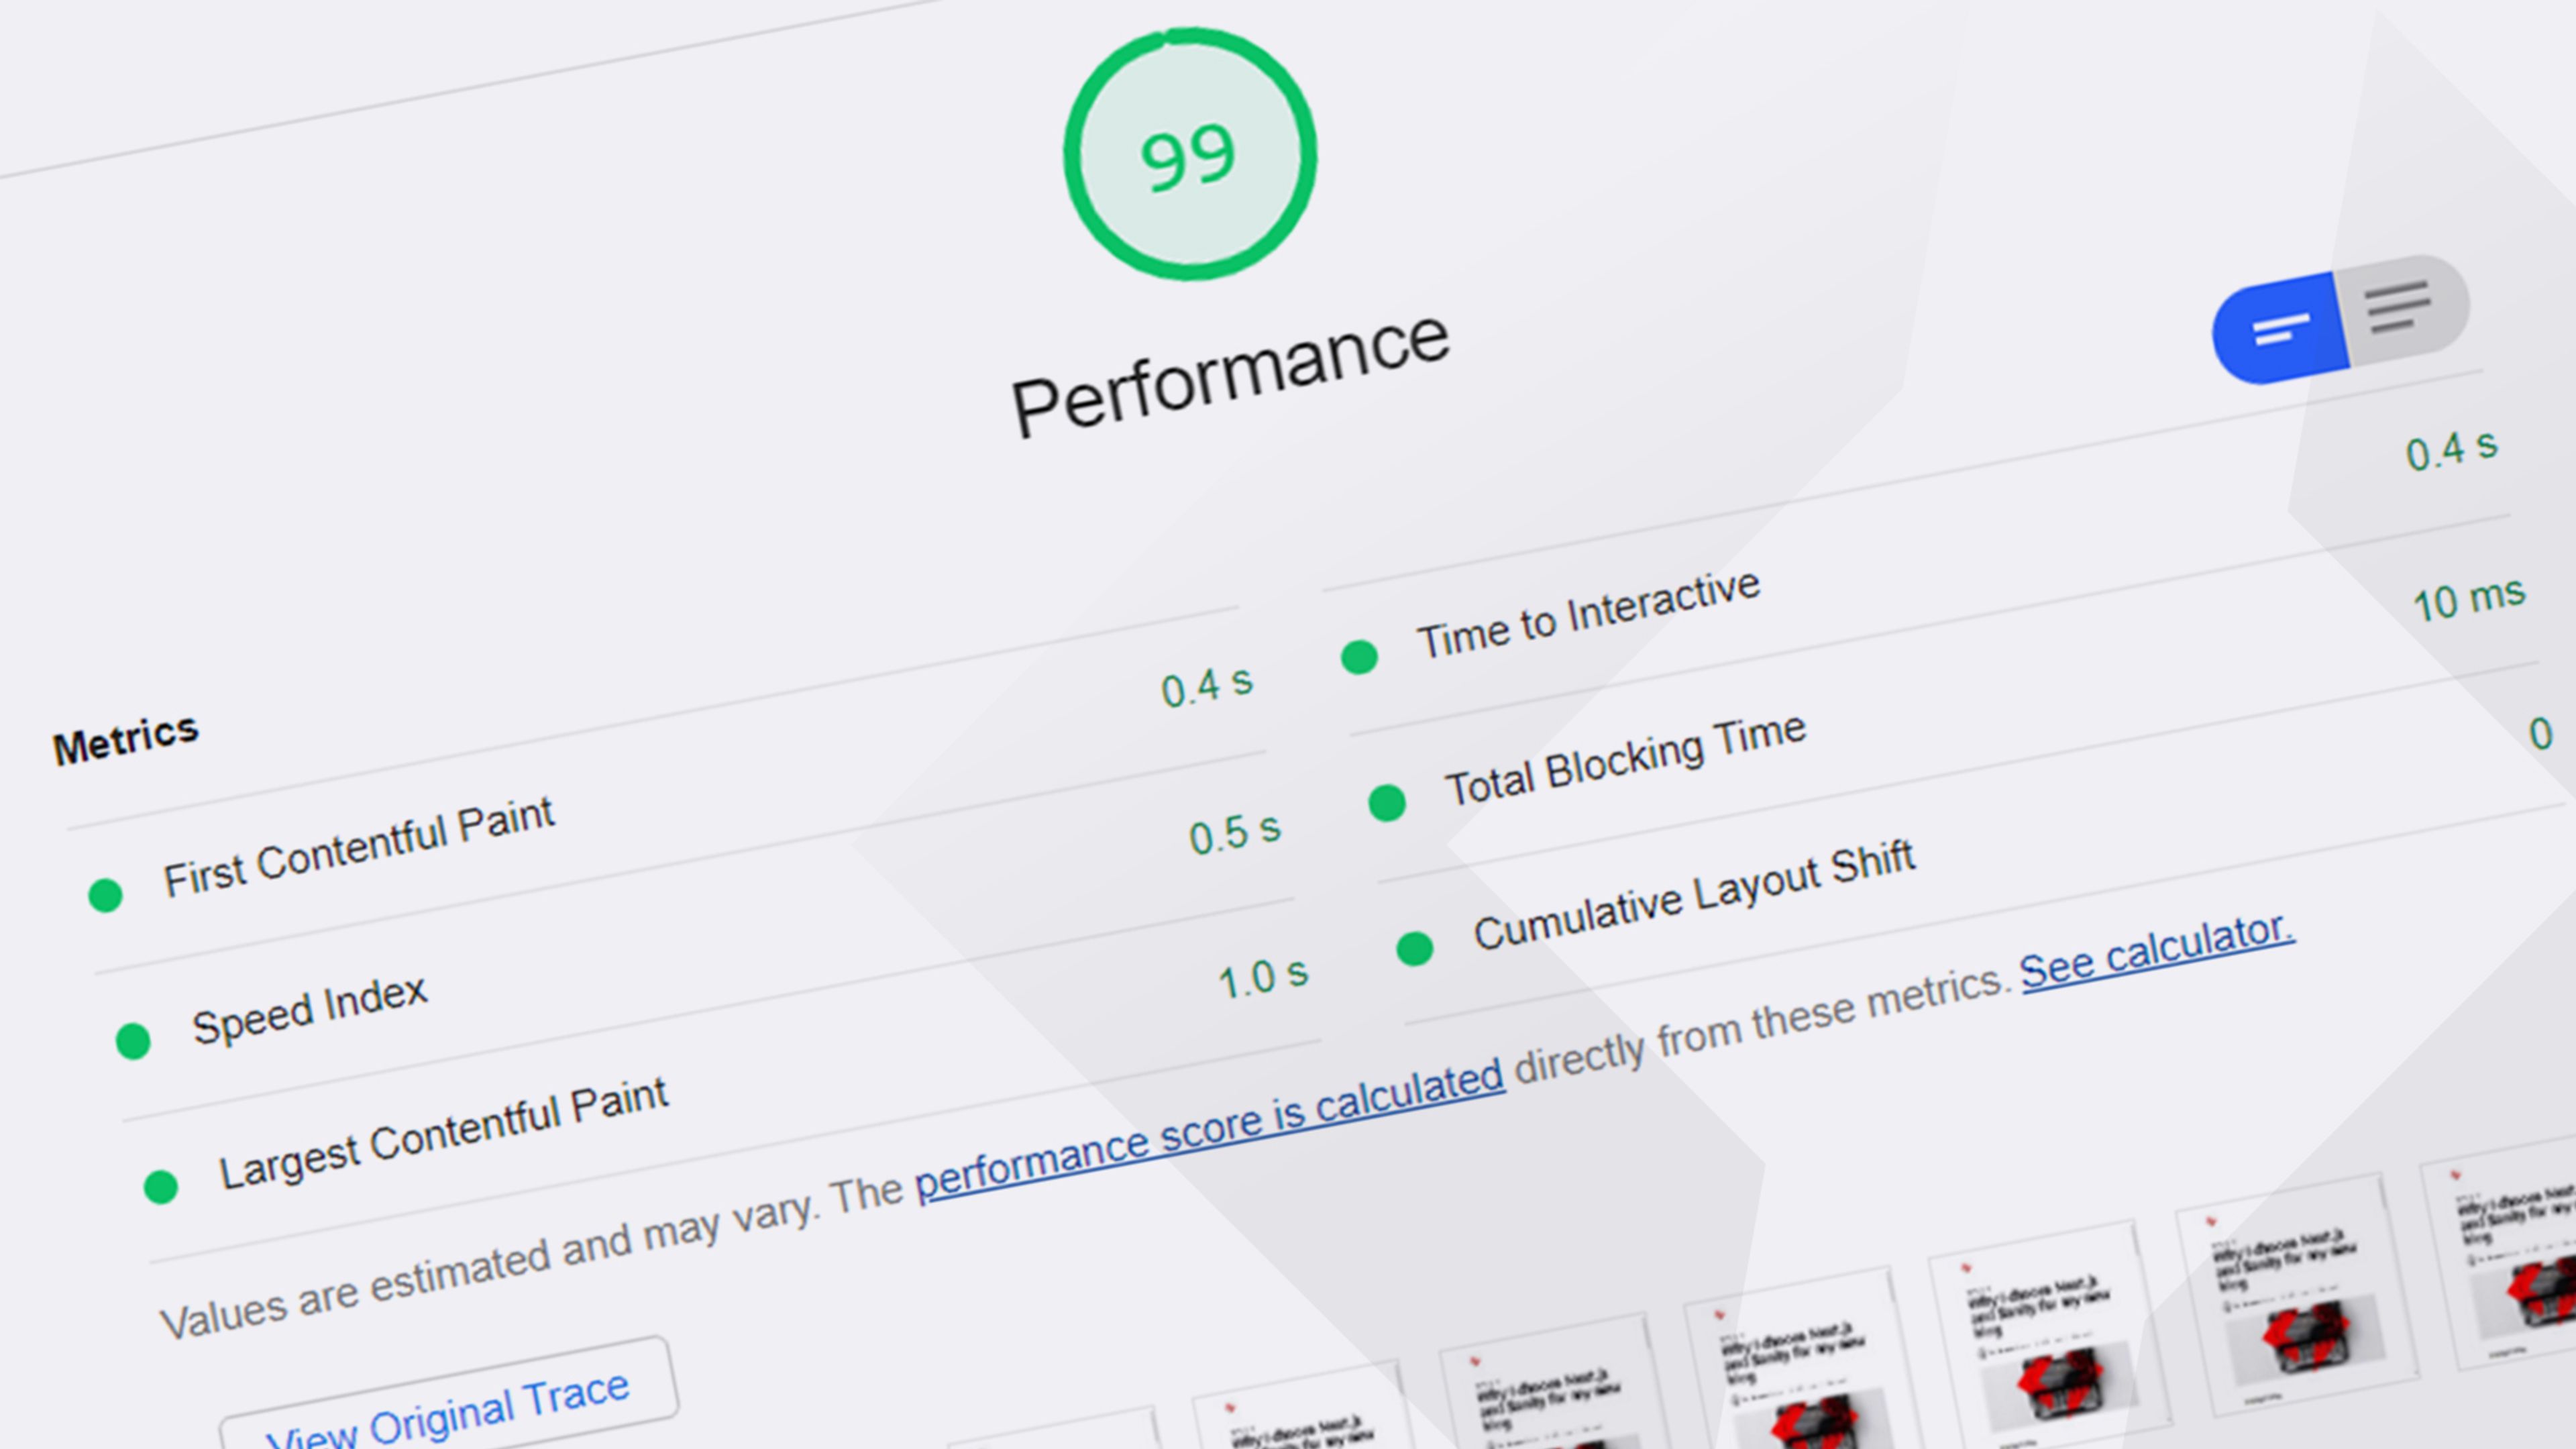
Lighthouse is my best tool to help pinpoint poor page performance culprits. To evaluate a page performance, go at https://web.dev/measure/, paste your page url and click the Run Audit button. After a few seconds you should get a summary report similar to this one:

As you can see, the page is getting pretty good scores but we see that some improvements are still needed at the FID level (Time to interactive and Total Blocking Time). Usually, FID performance problems are coming from Javascript, so let's look in more details the report.
Now click on the View Report link and scroll down the report page to get more details about what and where the performance weaknesses are:
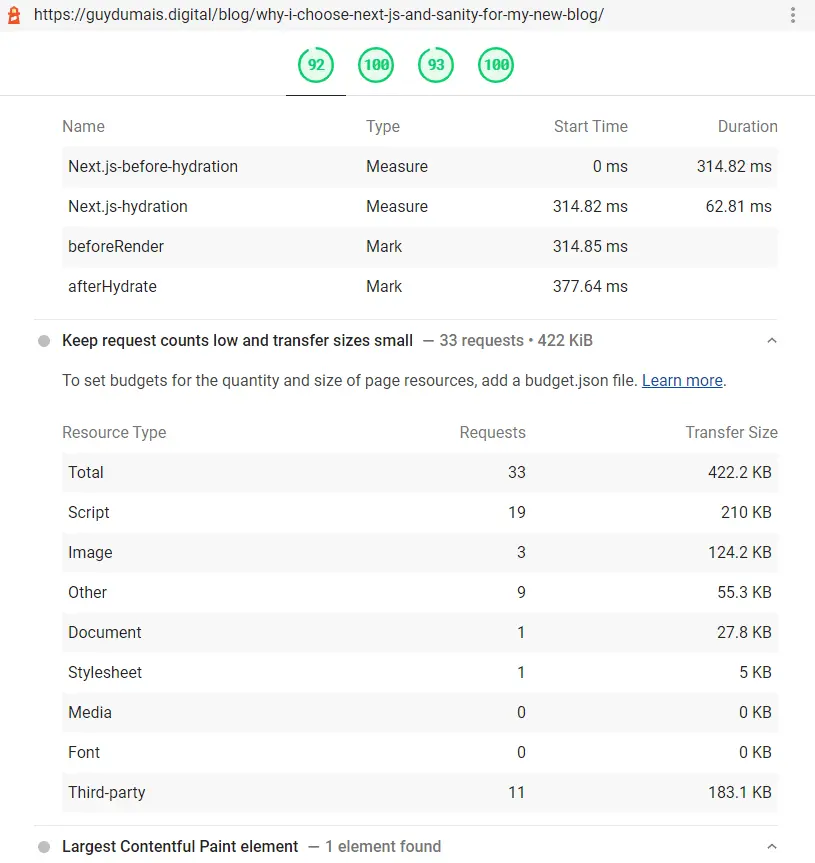
As shown above, the Hydration process is taking a bit too much time and also I have 11 requests coming from Third-party libraries. This is where I should investigate to improve the page performance. But I'll leave it for now since I'm getting an overall score over 90% which is good enough for now.
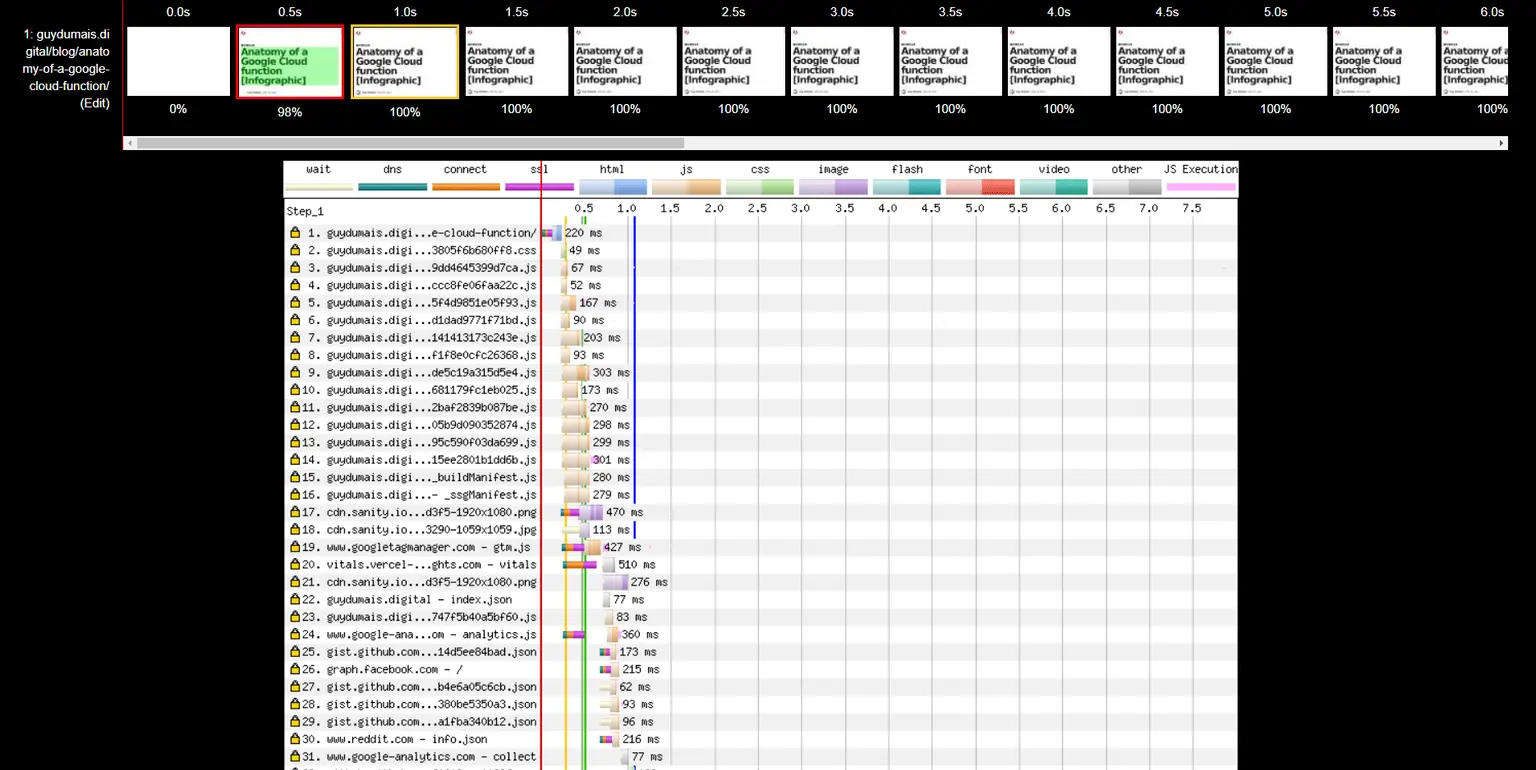
WebPageTest
Another one of my best tools to help identify performance problems in a page is https://www.webpagetest.org from Catchpoint. I particularly like the Filmstrip view where you clearly see the viewport elements getting laid out over time with a complete list of downloaded files. Pretty useful to detect LCP and CLS bugs.
GTMetrix
One tool that I’m using since almost the beginning of its availability is GTMetrix which offer a clear and easy to understand report about the Core Web Vitals scores of your pages:

Conclusion
My guess is that many web pages that appear in search results will be affected by the new page experience update, while others will not. How big of a penalty will it be? No one knows precisely, but personally, I think that those with quality content will be less affected, while those with poor user interface coding will be penalized.
Overall, what's important to keep in mind is that the new "Page Experience" signal is just one signal among many others. Existing search signals including mobile-friendliness, safe-browsing, HTTPS-security, and intrusive interstitial are still very strong signals. Thus, a poor Page Experience score will not systematically penalize content that gives the user exactly what they want in the first place, as relevance and intent remain very strong signals.
That said, only time will tell, but it's best to prepare now and the only way to minimize negative impacts is to test the performance of your web pages using the right tools that will help you assess and pinpoint problems at the source and then fix them.
In hope this article has been helpful, feel free to leave me your feedback or any question about improving your web vitals scores in the comment box below.
See You!

Comments: